Markets & competitiveness Perspectives 03
Colombian urea: the economics that must work
What it would take to compete with imports
Download PDFEnglish · 0.4 MB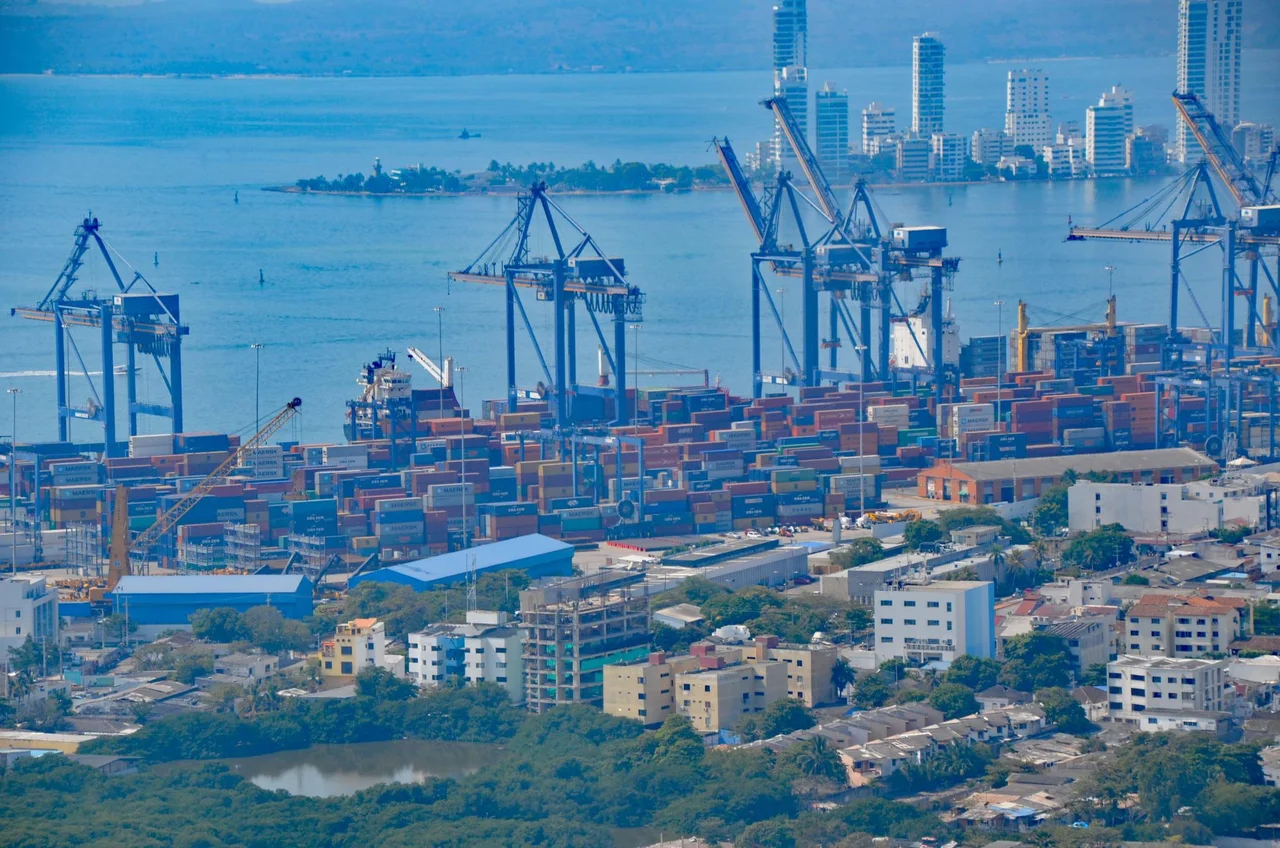
Key takeaways
- Compare equivalent offers at the same destination.
- Historical prices illustrate cycles, not current quotations.
- Covering operations and justifying construction are separate tests.
C&ENER · Perspectives 03 · October 2026 · English edition 1.0 · Based on approved Spanish edition 1.0
Producing urea in Colombia opens an industrial opportunity. Its economic test is to deliver a competitive product and sustain the business as market conditions change.
The comparison starts where the customer buys
A distributor needs urea for a particular date and region. It can compare an imported offer with one produced in Colombia. Its choice will consider price, quality, payment terms and confidence that the product will arrive when needed. The product’s domestic origin may matter; the complete offer determines the purchase.
Urea supplies nitrogen to crops. Domestic manufacturing would allow exploration of an additional supply source for agriculture. In September 2024, UPRA reported that Colombia was not producing urea, after having had domestic production decades earlier. That history explains the interest in studying a new industry; it does not yet establish its competitiveness. [1]
The first two articles in this series explained Colombia’s opportunity and the chain that converts coal into urea. The business question now follows: what would it take for domestic production to compete with bringing the product from abroad?
The answer requires three connected calculations: the cost of delivering fertilizer, the tonnes the plant can sell and the cash the business must generate to recover its investment. A local resource can help with the first. The project must address all three.
1. Two offers, one destination
Comparing the international urea price with a Colombian plant-gate cost leaves the calculation incomplete. Between each origin and the buyer lie transport, storage, financing and commercial terms. The useful comparison brings both offers to the same delivery point.
The price of the imported alternative must refer to an equivalent product and a comparable date. Presentation, specifications, volume, payment terms and delivery responsibilities must also match. A bulk price per tonne is not directly comparable with a bagged offer that includes financing.
A domestic plant’s location may offer a logistics advantage in some regions. It must be measured by corridor and customer: distance, transport availability, inventory and the cost of distribution throughout the year. Proximity to a mine helps supply the factory; proximity to the market helps sell its product. They are different advantages.
The producer must also consider how much revenue remains at the plant after delivery and commercialization. If it sells through distributors, it must recognize that channel’s role and remuneration. The price paid by the farmer does not become the manufacturer’s revenue in full.

Read figure description
TWO ROUTES, ONE DELIVERY POINT
IMPORTED
Origin and freight → port and inventory → distribution → buyer.
DOMESTIC
Production → inventory → distribution → the same buyer.
2. A crisis price cannot fund an entire plant lifetime
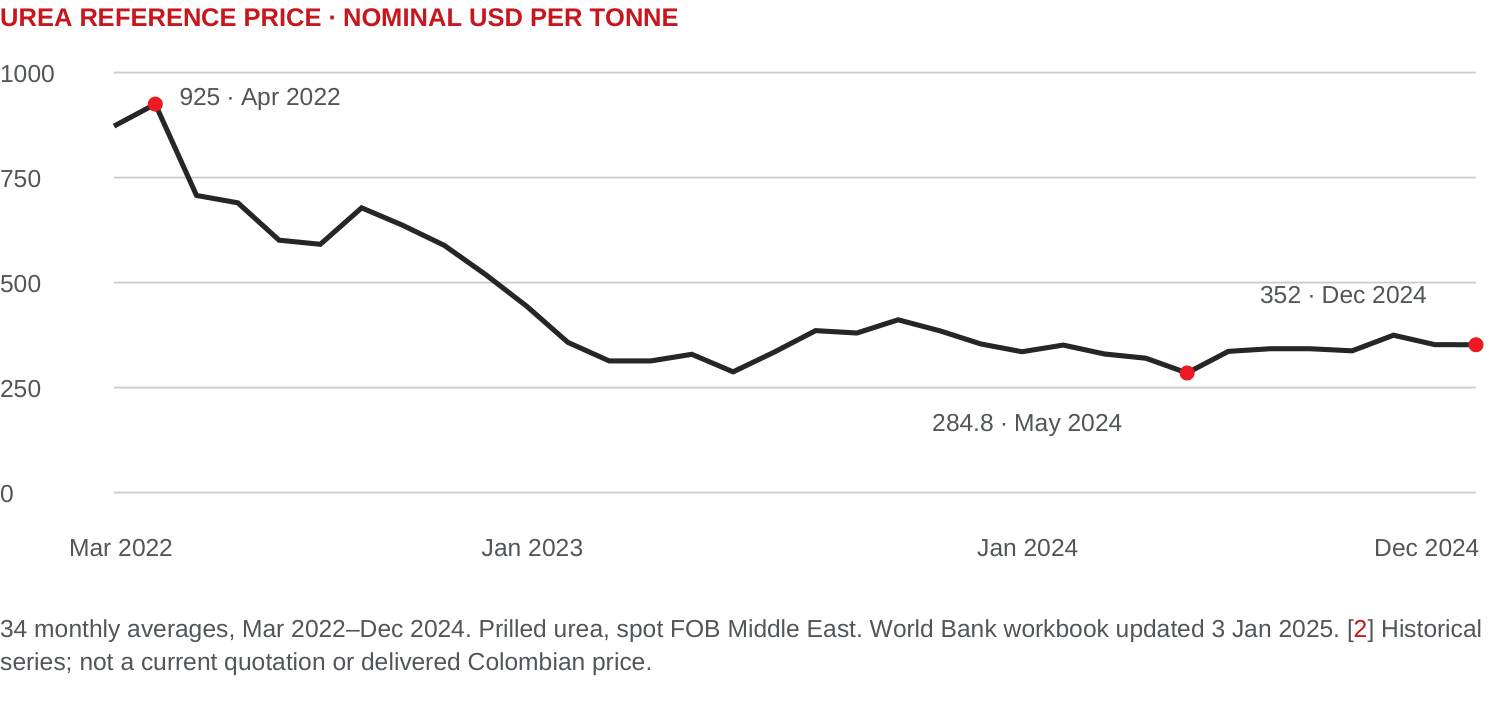
The market can change significantly before a facility is finished. The World Bank series records a monthly urea reference price of USD 925 per tonne in April 2022, compared with USD 284.8 in May 2024. In December 2024, it was USD 352. The reference is prilled urea on board at the origin port (FOB Middle East). It excludes the journey to Colombia. [2]
This illustrates why a high quotation alone says little about the return on a long-term investment. A project may appear comfortable at exceptional prices and lose margin when the market falls. The assessment must cover different price levels and explain how long the business could sustain itself at each.
Domestic production creates the possibility of diversifying supply. Even so, a Colombian factory would sell in a market connected with international offers. Domestic availability can add value through delivery times and inventories; its effect on prices will depend on competition, contracts and each supplier’s costs.
Read figure description
UREA REFERENCE PRICE · NOMINAL USD PER TONNE
0
250
500
750
1000
925 · Apr 2022
284.8 · May 2024
352 · Dec 2024
Mar 2022
Jan 2023
Jan 2024
Dec 2024
34 monthly averages, Mar 2022–Dec 2024. Prilled urea, spot FOB Middle East. World Bank workbook updated 3 Jan 2025. [2] Historical
series; not a current quotation or delivered Colombian price.
3. Competitive coal needs a competitive plant
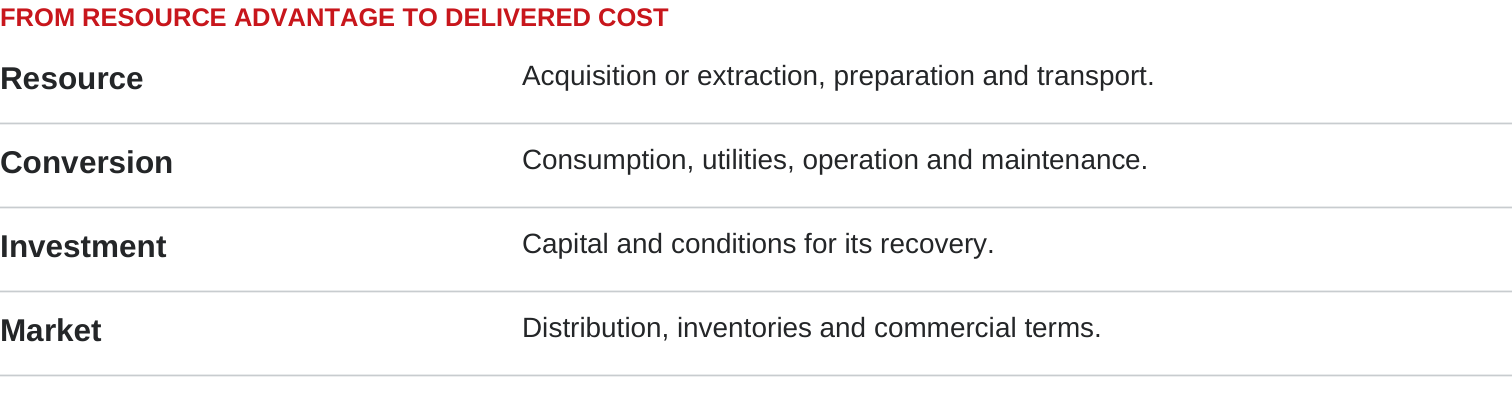
The appeal of local coal lies in turning an available resource into a reliable industrial feedstock. Assessing its economic contribution requires considering extraction or acquisition, preparation and transport costs alongside its performance in the selected technology. A low price per tonne does not tell the whole story if moisture, composition or treatment requirements change.
Electricity, water, steam, inputs and maintenance follow. The previous article showed how many connected units work together to produce urea. That integration also enters the economics: consumption per tonne and utility reliability affect the cost of the whole complex.
The IEA compares ammonia production routes by incorporating investment, fixed costs, energy and feedstock. Results vary with input prices and regional conditions. This structure is useful for organizing the assessment; its ammonia figures must not be transferred directly to a tonne of Colombian urea. [3]
The opportunity is to find a workable combination: suitable feedstock, compatible technology, available utilities and a reasonable commercial outlet. Engineering must express that combination in consumption rates and capacities; quotations and contracts must price them. This is how a geological advantage can become a measurable industrial advantage.
Read figure description
FROM RESOURCE ADVANTAGE TO DELIVERED COST
Resource
Acquisition or extraction, preparation and transport.
Conversion
Consumption, utilities, operation and maintenance.
Investment
Capital and conditions for its recovery.
Market
Distribution, inventories and commercial terms.
4. Tonnes not produced also carry a cost
A facility is announced by its capacity. The business lives on what it can produce and sell. Outages, maintenance, utility constraints or commercial difficulties can reduce the tonnes over which annual costs are spread.
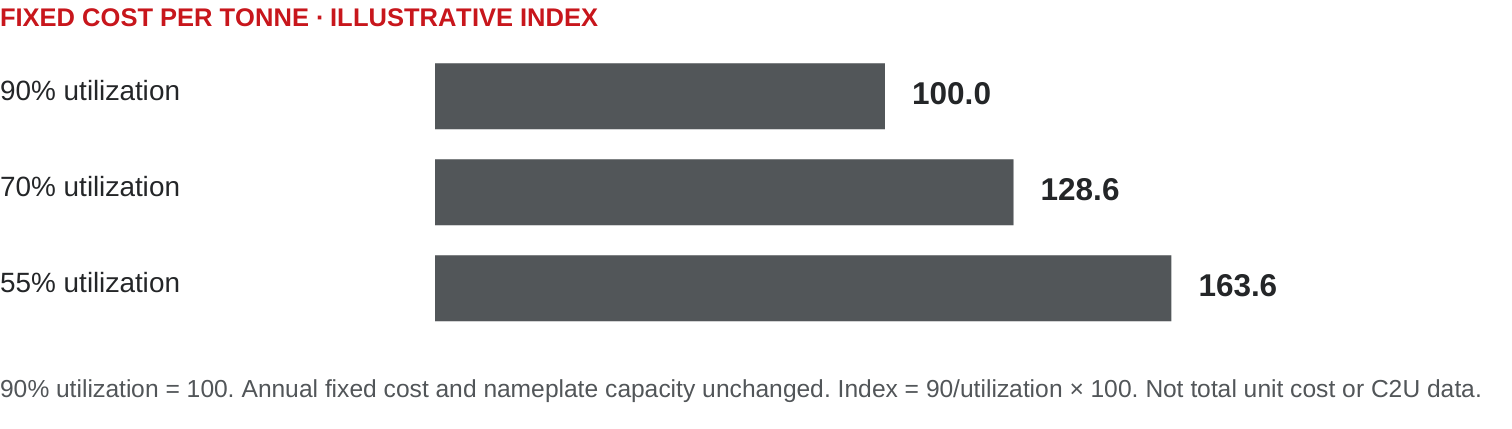
An example illustrates the effect. Assume annual fixed cost and nameplate capacity remain unchanged. If utilization falls from 90% to 70%, fixed cost per tonne rises by approximately 29%. The calculation is 90/70. Total cost per tonne does not necessarily rise by that percentage: the example concerns only its fixed component.
This helps explain the value of maintenance, spare parts, reliable electricity and coordination between units. It also requires distinguishing ramp-up from steady-state operations. Applying a mature plant’s utilization from the first year can make initial cash flow appear too favorable.
Selling is the other half. The model must connect production with accessible demand, inventories and collection of payments. If some output must be exported, that share requires its own calculation of transport, commercialization and net revenue. Profitability of domestic sales cannot be assumed for every tonne.
Read figure description
FIXED COST PER TONNE · ILLUSTRATIVE INDEX
90% utilization
100.0
70% utilization
128.6
55% utilization
163.6
90% utilization = 100. Annual fixed cost and nameplate capacity unchanged. Index = 90/utilization × 100. Not total unit cost or C2U data.
5. Operating and recovering investment are different tests
A plant may generate enough revenue to cover operating expenses while still failing to offer a return sufficient to justify construction. An investment decision must incorporate required capital, time to first sales and operating risk. The IEA’s cost comparison makes assumptions such as lifetime, utilization and discount rate explicit. Changing them changes the result. [3]
The complete budget must recognize the required connections and utilities, ramp-up and working capital: funds tied up in inventories and receivables while payments arrive. Longer payment terms can help sales and also require more financing. Margin and cash must be read together.
Currency matters too. A Colombian facility may combine peso-denominated expenses, dollar-denominated equipment and debt, and sales linked to international references. Domestic production does not automatically eliminate exchange-rate exposure. The model must show which revenues and outflows move with each currency, and when.
Finally, environmental design has economic consequences. Water treatment, waste management and decisions on CO₂ require equipment and operation. The IEA shows that adding capture and storage changes ammonia’s cost structure. [3] For Colombia, these items must be defined according to design and applicable obligations, without anticipating carbon revenue or attributing unproven emissions reductions to the project.

Read figure description
TWO QUESTIONS, SEPARATE ANSWERS
Can it operate?
Revenue and collections against operation and working capital.
Is construction justified?
Project cash flows against investment, time and risk.
The opportunity becomes concrete as a range
The most useful public answer would not be a single unexplained cost per tonne. It would be an intelligible range: under which input prices, investment, utilization and logistics a Colombian facility could compete, and how much margin it would retain if conditions deteriorated.
The next step is to build that comparison with engineering and commercial evidence: a production and consumption basis, a complete budget and equivalent offers at defined destinations. Demanding combinations should then be tested: lower urea prices, a slower ramp-up or higher energy costs. The question is how much the business can absorb before it needs different conditions.
Colombia has an opportunity worth studying with that discipline. Suitable coal and a favorable location may provide advantages. Turning them into competitive urea requires a chain that produces, delivers and collects payment, and sustains the investment across different market conditions.
Sources and scope
Public analysis of competitiveness conditions, not a feasibility study or investment recommendation. Editorial review: 30 October 2026. Price data illustrate a complete historical episode; they are not presented as 2026 quotations. Economic relationships without a specific citation are C&ENER analysis, not measured C2U results.
C&ENER explores industrial opportunities linked to Colombian resources, including C2U. This interest is disclosed. This article does not publish that project’s costs, capacity, returns or budget. Examples are illustrative; competitiveness conclusions require specific studies.
[1] UPRA / Ministry of Agriculture and Rural Development (2024). Agricultural input and animal-feed price index, September 2024, Urea 46-0-0 factsheet, p.7: production history and absence of Colombian production at that date. https://agronet.gov.co/sites/default/files/2025-11/01_BolInsumSep_20241101.pdf
[2] World Bank. Commodity Price Data—The Pink Sheet, monthly workbook updated 3 January 2025. Monthly Prices, Urea column; 34 observations, March 2022–December 2024. Description: prilled urea, spot FOB Middle East since March 2022; previously FOB Black Sea. Only the period after this reference change is used. Nominal USD per metric tonne. https://thedocs.worldbank.org/en/doc/5d903e848db1d1b83e0ec8f744e55570-0350012021/related/CMO-Historical-Data-Monthly.xlsx
[3] IEA (2021). Ammonia Technology Roadmap, pp.39–41 and notes on p.40: levelized cost, investment, operation, utilization and regional sensitivities; p.34: coal pathway; p.119: input and CO₂ sensitivities. Ammonia analyses under report assumptions, not current urea quotations or Colombian costs. https://iea.blob.core.windows.net/assets/6ee41bb9-8e81-4b64-8701-2acc064ff6e4/AmmoniaTechnologyRoadmap.pdf
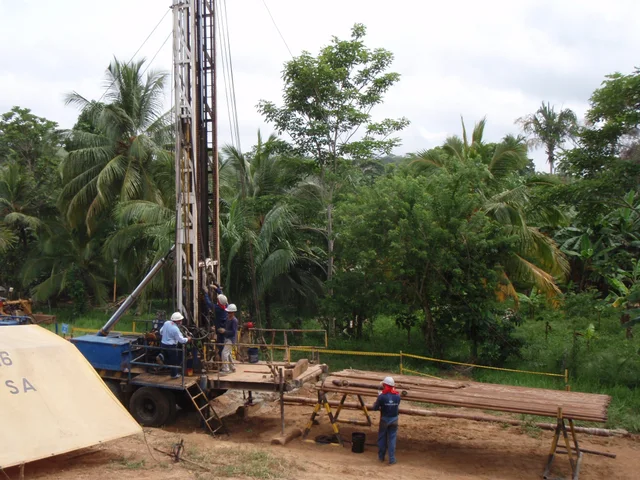
Opening photograph: Cartagena port from La Popa, January 2016. Joe Ross, Wikimedia Commons. CC BY-SA 2.0. Editorial crop; logistics context, not a urea shipment. https://commons.wikimedia.org/wiki/File:Container_ship_loading_port,_as_seen_from_La_Popa,_Cartagena,_Colombia_(24981320915).jpg https://creativecommons.org/licenses/by-sa/2.0/
Exhibits and calculations: C&ENER. Historical chart from [2]. Illustrative fixed-cost-per-tonne index = 90/utilization × 100, with utilization in percentage points and 90% = 100. At 70%: 128.57; at 55%: 163.64. Neither total cost nor C2U results.
Perspectives 03
The full analysis, also as a PDF.
Keep the publication with its figures, references and scope.